Tell us about the job
Takes about a minute. No obligation.
Sizing a heat pump for Colusa County starts with what the equipment has to deliver on its hardest days, not its average ones. Homes in Colusa County, CA run heat about six months a year, from November through April. A heat pump loses capacity as outdoor temperatures drop, so the coldest weeks of that stretch set the floor a contractor has to design above. Installers working here factor in whether supplemental resistance heat is needed, how the backup integrates with the primary refrigerant circuit, and what the existing service panel can carry. Get the sizing wrong and the compressor runs long cycles under strain every cold night rather than occasionally.
Electrical service in much of this county's housing was designed around loads that heat pump systems run past. Half the homes in Colusa County, California were built in 1978 or earlier (2020-2024 ACS 5-year). A contractor pricing a heat pump installation here has to measure what the panel actually carries before the equipment quote means anything, because a panel sized for the original system may need an upgrade before the new unit can run. The ductwork gets the same look: older flex or metal runs that handled a different system do not automatically carry a heat pump's air volume without inspection and sometimes modification.
What Gets Installed With a New Heat Pump
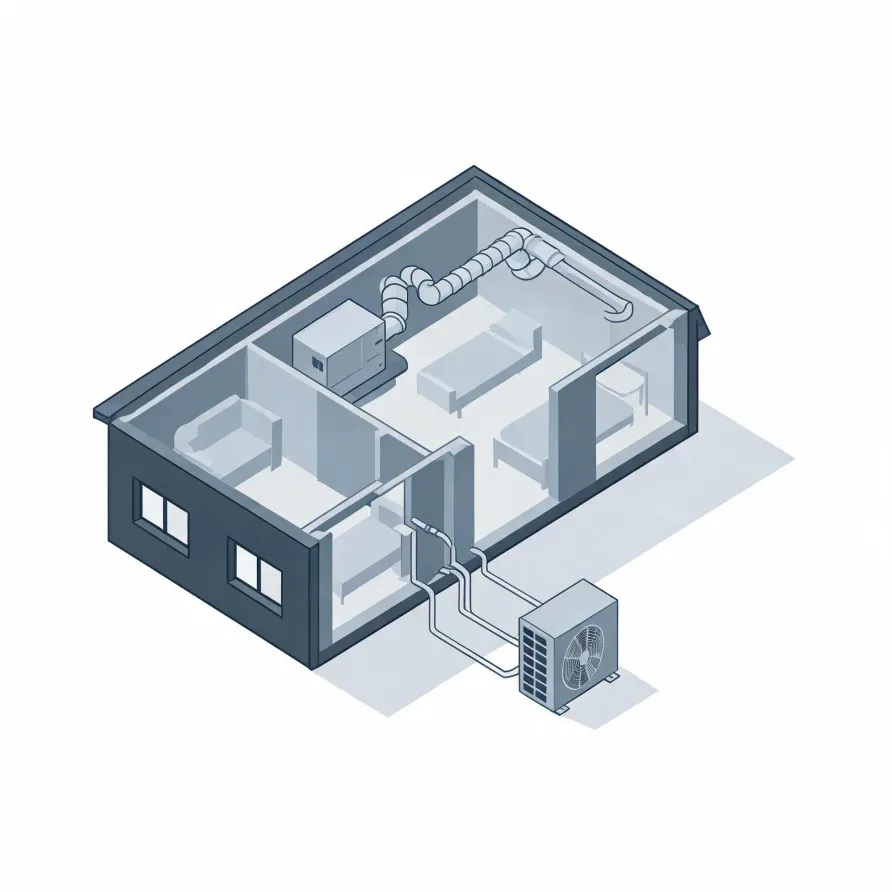
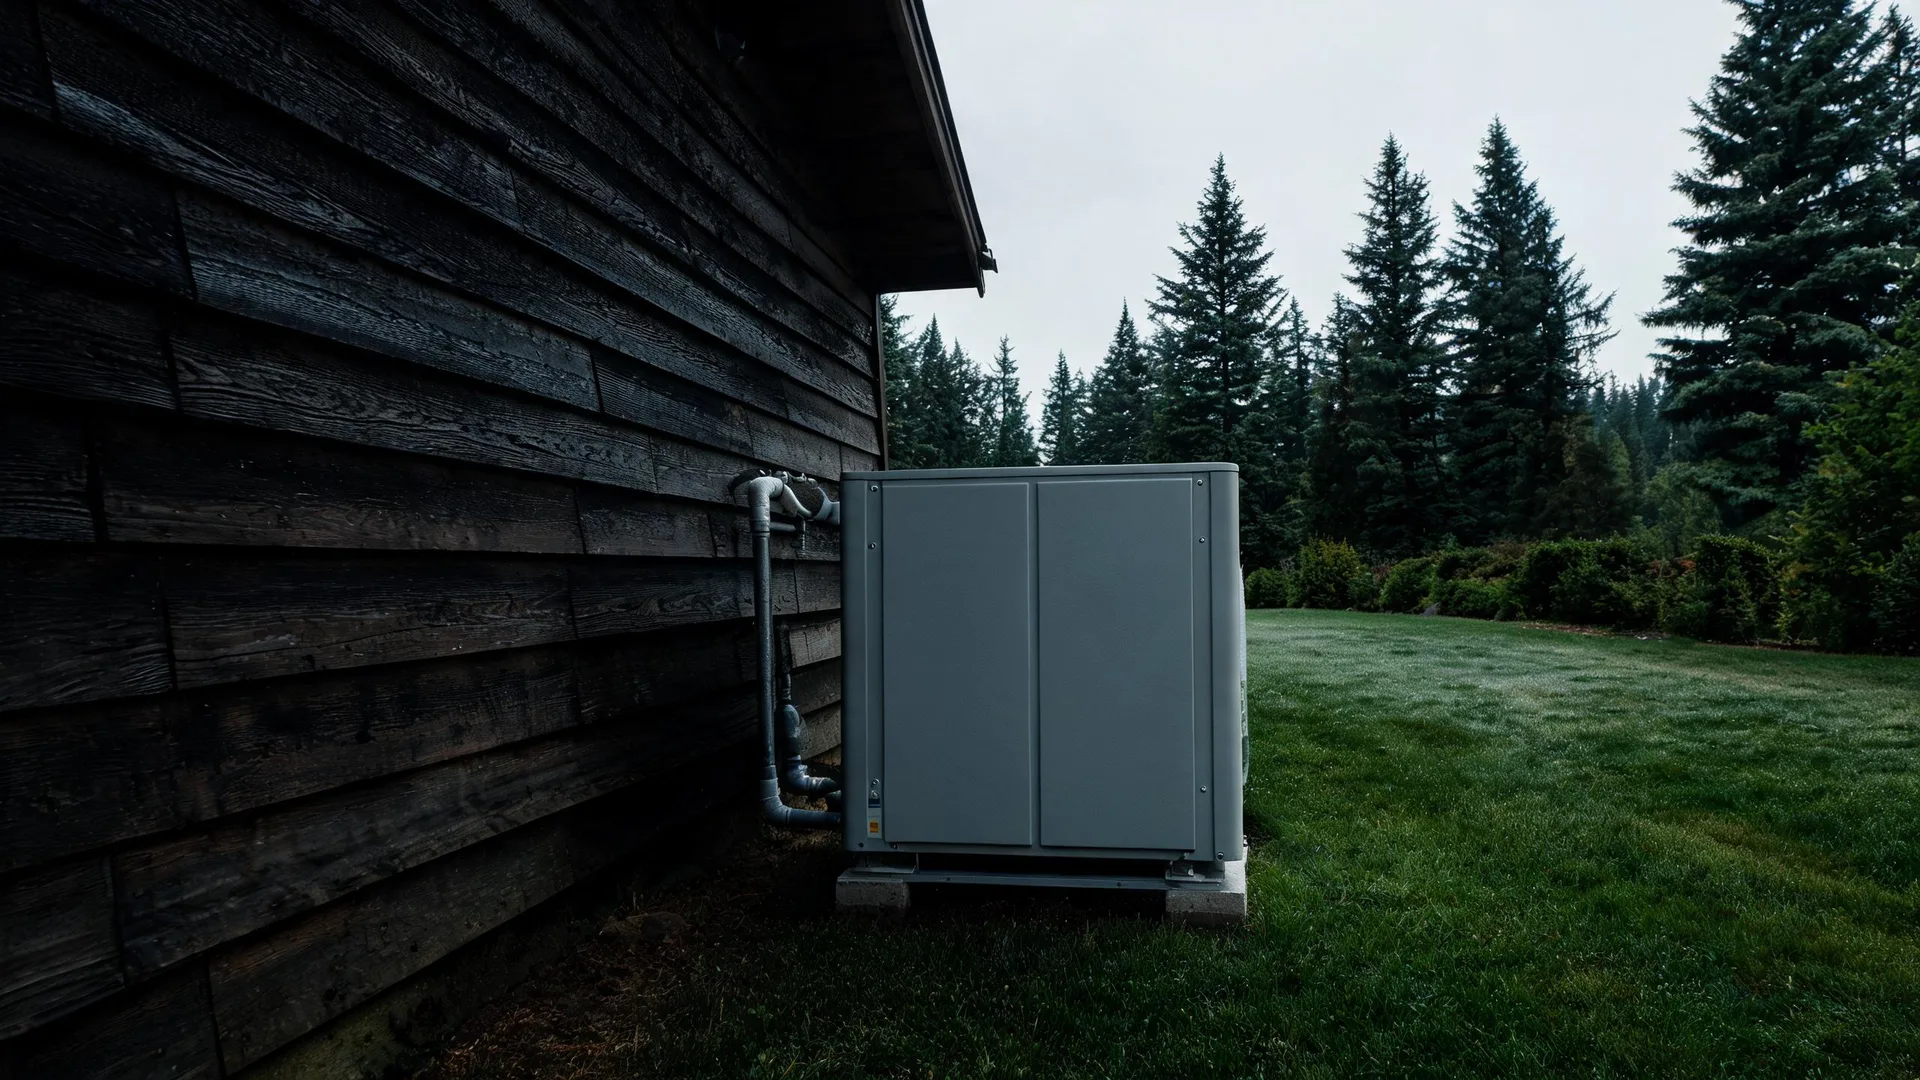
The outdoor unit is the piece most homeowners see first, mounted on a concrete pad or wall bracket outside the house, and it holds the compressor and the main coil that pulls heat from the outside air. Inside, the air handler sits in a utility closet, attic, or basement and pushes conditioned air through the home.
A copper refrigerant line set runs between the two units, connecting the outdoor and indoor sides of the system. A thermostat goes on an interior wall and gives the homeowner control over the whole setup.
The drawing shows a typical layout, and a licensed contractor determines what applies to this particular house.
Get matched in Colusa CountyColusa County, by the numbers
30 severe weather events were recorded in Colusa County, California between 2015 and 2024.
NOAA National Centers for Environmental Information, Storm Events Database, bulk CSV export, events 2015-01-01 through 2024-12-31.Half the homes in Colusa County, California were built in 1978 or earlier (2020-2024 ACS 5-year).
U.S. Census Bureau, 2020-2024 American Community Survey 5-Year EstimatesColusa County, California holds 8,211 housing units (2020-2024 ACS 5-year).
U.S. Census Bureau, 2020-2024 American Community Survey 5-Year EstimatesOwners occupy 62.2% of the occupied homes in Colusa County, California (2020-2024 ACS 5-year).
U.S. Census Bureau, 2020-2024 American Community Survey 5-Year EstimatesRules and Standards Governing Heat Pump Installation in Colusa County, California1 sourced rules and standards
Licensing and Legal Requirements in Colusa County, California
California requires a state contractor license: it is a misdemeanour to engage in the business of, or act in the capacity of, a contractor in California without one, unless the work is exempt.
Severe Weather Events in Colusa County
Extreme weather puts a direct load on heating and cooling equipment, and how hard a heat pump works over its life is shaped by what the local climate throws at it. That makes weather history a practical input for any installation decision in this area.
30 severe weather events, 2016–2024. Source: NOAA National Centers for Environmental Information, Storm Events Database.