Tell us about the job
Takes about a minute. No obligation.
Sizing a heat pump for this county starts with the heating side, not the cooling side. Homes in San Bernardino County, CA run heat about five months a year, from November through March. A heat pump loses capacity as outdoor temperatures fall, and the colder nights here decide whether the unit can carry the house on its own or whether backup resistance heat fills the gap. A contractor who skips a proper load calculation leaves that question unanswered, and an undersized unit running backup heat through a full heating season moves the operating cost well past what the homeowner was quoted.
Ductwork laid down for a gas furnace or a window-unit house runs at different pressures and in different configurations than a heat pump needs. Half the homes in San Bernardino County, California were built in 1983 or earlier (2020-2024 ACS 5-year). A contractor pricing a heat pump installation here opens walls and attic hatches to see what the existing duct system will actually carry, because the answer changes the scope before the equipment selection does. Electrical service gets the same check: a heat pump's draw is a different number than whatever the panel was originally provisioned for, and that gap has to close before the unit runs.
What Gets Installed With a New Heat Pump
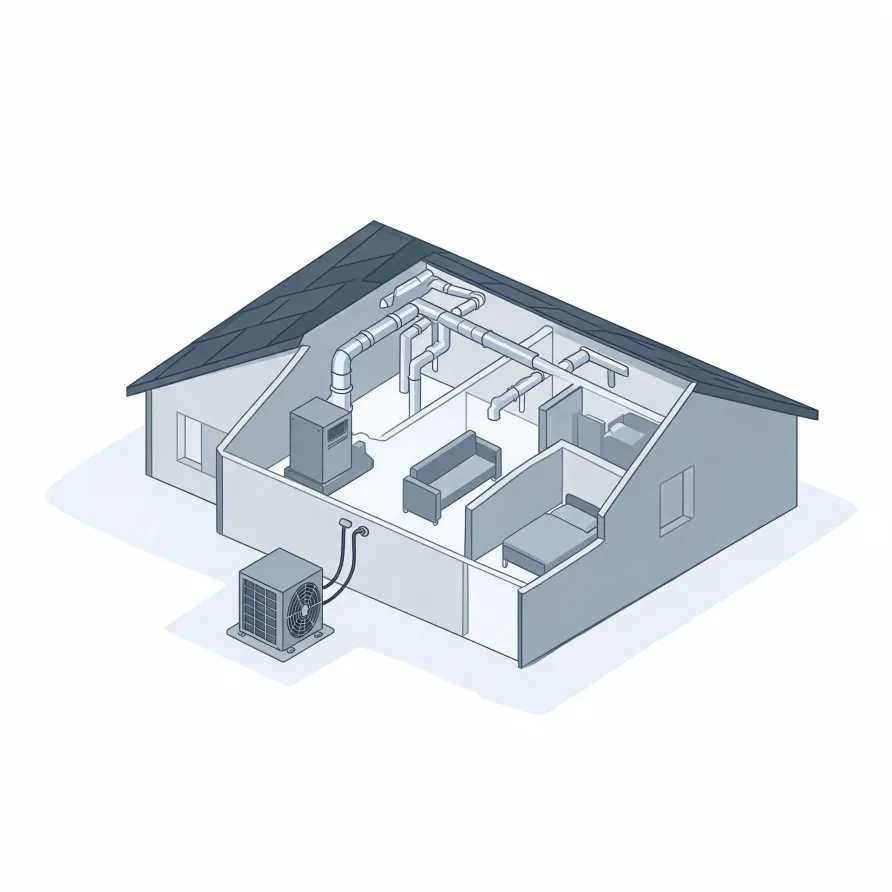
The outdoor unit is the piece most homeowners notice first. It sits on a pad beside the house and holds the compressor and the main coil. Inside, the air handler mounts in a utility closet, attic, or basement and circulates conditioned air through the home.
A refrigerant line set runs between the two units, carrying the working fluid that lets them act as a single system. A thermostat goes on an interior wall and gives the homeowner control over the whole setup.
The drawing shows the general layout of these components, and a licensed contractor determines exactly what applies to this house.
Get matched in San Bernardino CountySan Bernardino County, by the numbers
557 severe weather events were recorded in San Bernardino County, California between 2015 and 2024.
NOAA National Centers for Environmental Information, Storm Events Database, bulk CSV export, events 2015-01-01 through 2024-12-31.Half the homes in San Bernardino County, California were built in 1983 or earlier (2020-2024 ACS 5-year).
U.S. Census Bureau, 2020-2024 American Community Survey 5-Year EstimatesSan Bernardino County, California holds 743,886 housing units (2020-2024 ACS 5-year).
U.S. Census Bureau, 2020-2024 American Community Survey 5-Year EstimatesOwners occupy 62.1% of the occupied homes in San Bernardino County, California (2020-2024 ACS 5-year).
U.S. Census Bureau, 2020-2024 American Community Survey 5-Year EstimatesRules & Standards Governing Heat Pump Installation in San Bernardino County, California1 sourced rules and standards
Licensing and Legal Requirements in San Bernardino County, California
California requires a state contractor license: it is a misdemeanour to engage in the business of, or act in the capacity of, a contractor in California without one, unless the work is exempt.
Severe Weather Events in San Bernardino County
Weather shapes how hard heating and cooling equipment has to work, and San Bernardino County's climate is not uniform across its geography. A heat pump sized and installed for local conditions handles demand differently than one spec'd without that picture in mind.
557 severe weather events, 2015–2024. Source: NOAA National Centers for Environmental Information, Storm Events Database.